
July 22, 2024

Here's a mid-summer update on markets with some explanatory charts.
Picture: temporary office in Italy!
Bad equity sessions
Last week we have seen the worst week in stock markets since April of this year, as many investors have sold the big tech companies that have worked well until now to rotate in other parts of the market.
Weekly performance of key stock markets:
S&P 500 -2.4%
Stoxx 600:-2.5%
Reasons to be concerned?
As we have discussed last week about the dis-inversion of the curve and we have reported that such indicator normally screams loudly about a recession to come soon, should we be worried?
Quick answer: we shouldn't.
We reported a number of reasons why this time should be different. With lowering inflation and normalizing rates, longer dated yields are picking up while the upper pressure on shorter dated yields is fading. In other words, the dis-inversion is a natural process coming from inflation normalization (and not from the genuine rising of recession risk).
The market weakness in equities is just a long overdue reaction to bombastic valuations in tech. In parallel, after a positive stream of compression days, bond yields have risen as of late(prices down) affecting sentiment a bit.
Finally, summer is here and less operators are available to make the market so the usual patch of illiquid sessions is here to stay until mid August. Experience has told us to minimize trading here.
News on rates
The US central bank has released some comments reporting that they need more convincing signs of lowering inflation before cutting rates - the mistake could be to cut too early (during the summer). No big news there.
What to do
In equities, your biggest friend in this summer less-than-liquid environment is investing in Quality names to hedge against volatile sessions while in bonds you can either continue protecting your portfolio in ultrashort liquid positions or increase your protection against a possible slowdown by buying intermediated bonds (2-5 year duration - see list from last week's newsletter).
In our investment strategy, we have approx. a 20% position in fixed income right now, half of which in the US (entirely ultra-short) and half in Europe (of which 2/3 in short duration bonds and 1/3 in medium duration year bonds).
Charts to monitor
----- US inflation expectations
Take a look at the "Trump trade" unfolding Thursday and Friday of last week: a big jump higher in inflation expectations (looking at the US 5y5y forward).
Why?
This is due to the expected build up of tariffs from the Trump administration (if elected in November) driving possibly inflation up again in the US.

Now that we know that Biden dropped out of the race and Kamala will likely replace him, this trade will potentially unwind.
----- US interest expense on public debt
Any elected administration in the US will have much less space for spending, as government debt is rising and interest expense is going up with it

----- Growth
US real-time indicators point out to ongoing and sustained growth, which is positive.
But we should also notice a gentle softening of employment data (see job openings and )


By the way, we notice the same softening in employment expectations in the European job market.

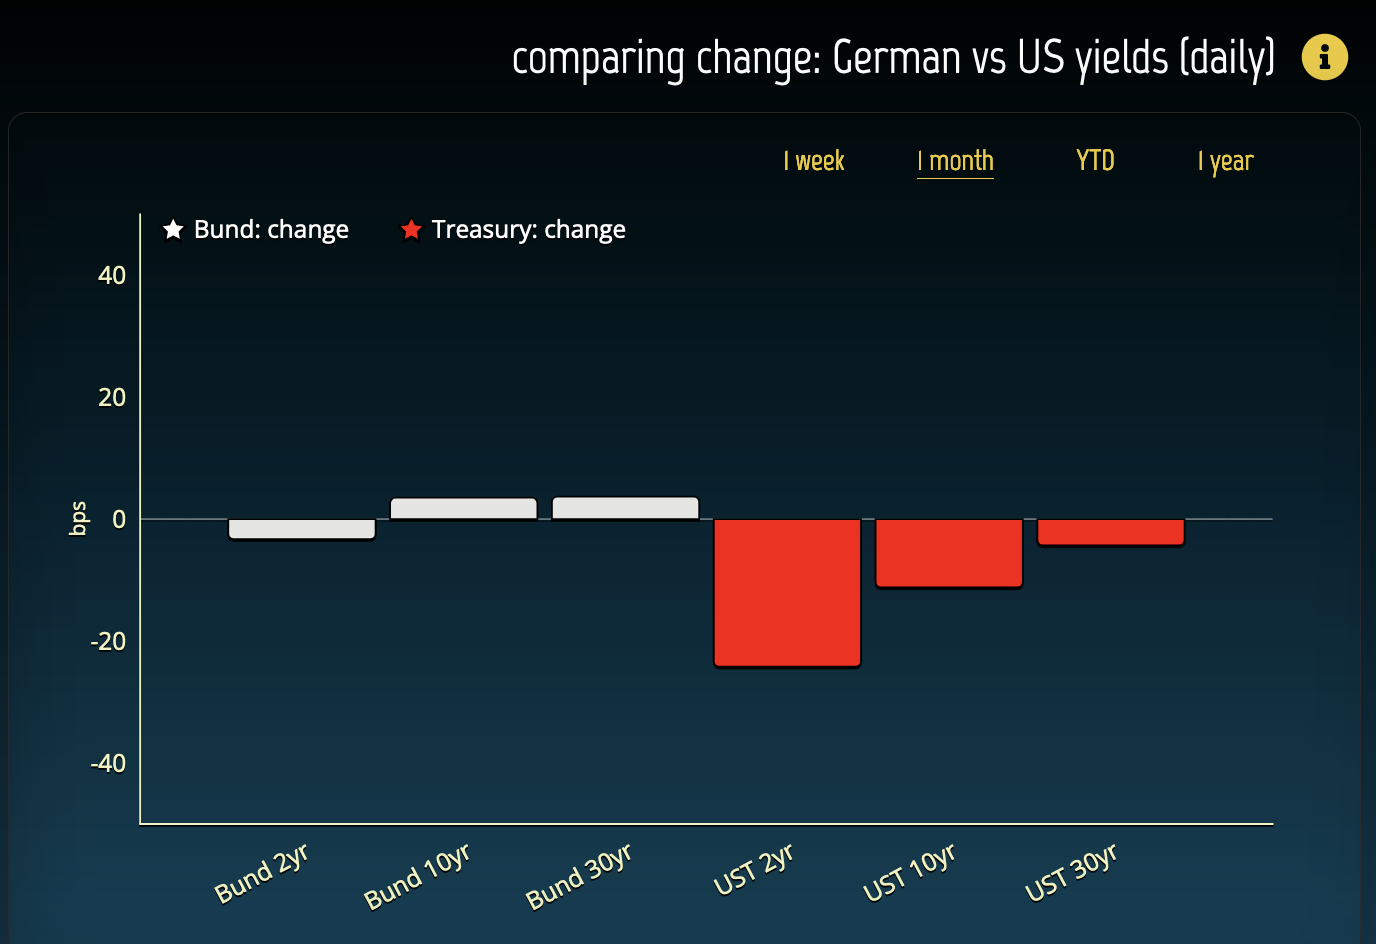
--- fixed income trends
The temporary compression of US Treasury yields in the past month vs European govies (measured via the German proxies), as evidenced in the chart below, seems to be the driving force behind the current USD weakness (second chart, blue line showing the EURUSD)

--- equity trends
The weakness in tech is evident in both EU (first chart) and US (second chart)


The general mood of equity investors seems more relaxed in US (first chart below with cyclicals clearly winning, still) than in EU anyway, where the relative stream of better performance by defensives continues since June...


The equity "Quality trade" wins alongside Dividend payers as temporary hedge against tech weakness.

Speak soon!
